Benford's Mystery Explained
Here is a summary of the explanation given on wikipedia.
Benford's Law can be explained if one assumes that the mantissae of the logarithms of the numbers are uniformly distributed; and this is likely to be approximately true if the numbers range over several orders of magnitude. For many sets of numbers, especially sets that can grow exponentially, such as incomes and stock prices, this is a reasonable assumption.
Consider the logarithmic scale shown below. If we pick a random position on this number line, then roughly 30% of the time the first digit of the number will be 1.
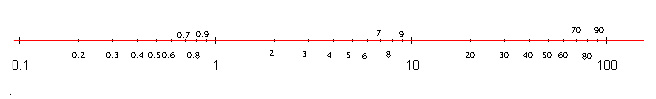
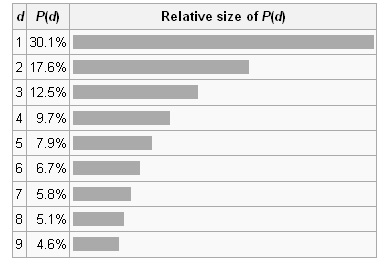
The quantity P(d) is proportional to the space between d and d + 1 on a logarithmic scale. Therefore, this is the distribution expected if the mantissae of the logarithms of the numbers (but not the numbers themselves) are uniformly and randomly distributed. For example, a number x, constrained to lie between 1 and 10, starts with the digit 1 if 1 ≤ x < 2, and starts with the digit 9 if 9 ≤ x < 10. Therefore, x starts with the digit 1 if log 1 ≤ log x < log 2, or starts with 9 if log 9 ≤ log x < log 10. The interval [log 1, log 2] is much wider than the interval [log 9, log 10] (0.30 and 0.05 respectively); therefore if log x is uniformly and randomly distributed, it is much more likely to fall into the wider interval than the narrower interval, ie more likely to start with 1 than with 9. The probabilities are proportional to the interval widths, and this gives the Benford distribution.
For example, if a quantity increases continuously and doubles every year, then it will be twice its original value after one year, four times its original value after two years, eight times its original value after three years, and so on. When this quantity reaches a value of 100, the value will have a leading digit of 1 for a year, reaching 200 at the end of the year. Over the course of the next year, the value increases from 200 to 400; it will have a leading digit of 2 for a little over seven months, and 3 for the remaining five months. In the third year, the leading digit will pass through 4, 5, 6, and 7, spending less and less time with each succeeding digit, reaching 800 at the end of the year. Early in the fourth year, the leading digit will pass through 8 and 9. The leading digit returns to 1 when the value reaches 1000, and the process starts again, taking a year to double from 1000 to 2000. From this example, it can be seen that if the value is sampled at uniformly distributed random times throughout those years, it is more likely to be measured when the leading digit is 1, and successively less likely to be measured with higher leading digits.
This example makes it plausible that data tables that involve measurements of exponentially growing quantities will agree with Benford's Law. But the law also holds for many cases where an exponential growth pattern is not obvious.